There are affiliate links on this page.
Read our disclosure policy to learn more.
2008 Internet Fraud, Scam and Crime Statistics
Internet Fraud, Scam and Crime Statistics - 2009
Statistics regarding internet scams and frauds are presented here as a snapshot in time January 2009, but below are links to archived statistics from previous years. Web crime statistics are notoriously difficult to obtain, with many sources each calculating them in a different manner and different time frame, using a different source.
To provide the most reliable picture, we use the Internet Crime Complaint Center's (IC3) statistics as a baseline. The IC3 began operation on May 8, 2000, as the Internet Fraud Complaint Center and was established as a partnership between the National White Collar Crime Center (NW3C) and the Federal Bureau of Investigation (FBI) to serve as a vehicle to receive, develop, and refer criminal complaints regarding the rapidly expanding arena of cyber crime. These statistics have the advantage of the FBI's expertise, but the weakness of being 1 to 2 years out of date.
To overcome that we add our own tracking system statistics to update the FBI / IC3 statistics.
Background
The statistics for the current Top 10 frauds and scams list can be found
below. A description of these scams is on this page. The greatest challenge in assembling a list and
statistics of the frauds is that most fall into several categories. Consumers
may characterize crime problems with
an easier "broad" character, which may be misleading. For instance, a consumer
that gets lured to an auction site which appears to be eBay, may later find that
they were victimized through a cyber scheme. The scheme may in fact have
involved SPAM, unsolicited e-mail inviting them to a site, and a "spoofed"
website which only imitated the true legitimate site. The aforementioned crime
problem could be characterized as SPAM, phishing, possible identity theft,
credit card fraud or auction fraud. In such scenarios, many complainants have
depicted schemes such
as auction fraud even though that label may be incomplete or misleading.
The Internet Crime Complaint Center, in 2009 released its latest annual report on victims' complaints received and referred to law enforcement.
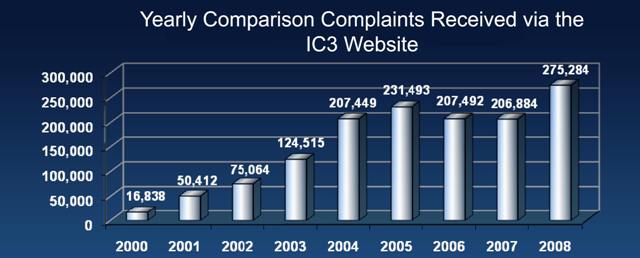
From January 1, 2008 - December 31, 2008, the IC3 website received 275,284 complaint submissions. This is a (33.1%) increase when compared to 2007 when 206,884 complaints were received. These filings were composed of complaints primarily related to fraudulent and non-fraudulent issues on the Internet.
These complaints were composed of many different fraud types such as auction
fraud, non-delivery, and credit/debit card fraud as well as non-fraudulent
complaints such as computer intrusions, spam/unsolicited e-mail, and child
pornography. All of these complaints are accessible to federal, state, and local
law enforcement to support active investigations, trend analysis, and public
outreach and awareness efforts.
From the submissions, IC3 referred 72,940 complaints of crime to federal, state,
and local law enforcement agencies around the country for further consideration.
The vast majority of cases were fraudulent in nature and involved a financial
loss on the part of the complainant. The total dollar loss from all referred
cases of fraud was $264.6 million with a median dollar loss of $931.00 per
complaint. This is up from $239.1 million in total reported losses in 2007.
Other significant findings related to an analysis of referrals include:
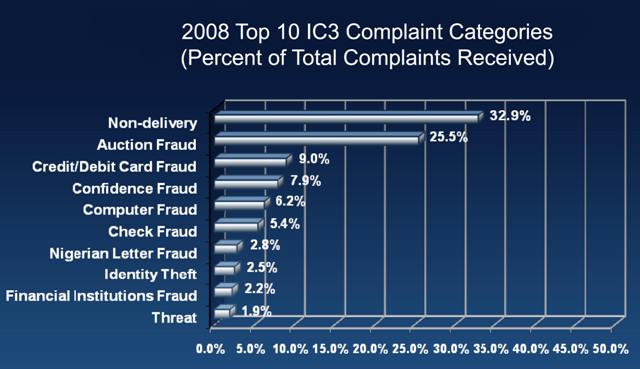
- Non-delivered merchandise and/or payment was, by far, the most reported offense, comprising 32.9% of referred complaints.
- Internet auction fraud accounted for 25.5% of referred complaints.
- Credit/debit card fraud made up 9.0% of referred complaints.
- Confidence fraud ("con men"), computer fraud, check fraud, and Nigerian letter fraud (Also called "Advance Fee Fraud" or AFF) round out the top seven categories of complaints referred to law enforcement during the year.
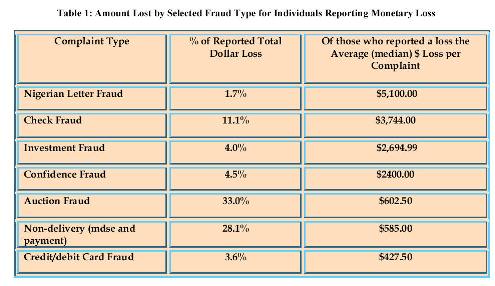
Of those complaints reporting a dollar loss, the highest median losses were found among
- check fraud ($3,000),
- confidence fraud ($2,000),
- Nigerian (west African, 419, Advance Fee) letter fraud ($1,650)
Amount Lost by Selected Fraud Type for
Individuals Reporting Monetary Loss|
Complaint Type |
Percentage of Reported Total Loss |
Of those who reported a loss the Average (median) $ Loss per Complaint |
| Check Fraud |
7.8% |
$3,000.00 |
| Confidence Fraud |
14.4% |
$2,000.00 |
| Nigerian Letter Fraud |
5.2% |
$1,650.00 |
| Computer Fraud |
3.8% |
$1,000.00 |
| Non-delivery (merchandise and payment) |
28.6% |
$800.00 |
| Auction Fraud |
16.3% |
$610.00 |
| Credit/Debit Card Fraud |
4.7% |
$223.00 |
Among perpetrators,
- 77.4% were male and
- 50% resided in one of the following states: California, New York, Florida, Texas, District of Columbia, and Washington.
- The majority of reported perpetrators (66.1%) were from the United States; however, a significant number of perpetrators where also located in the United Kingdom , Nigeria , Canada , China, and South Africa.
Among complainants,
- 55.4% were male,
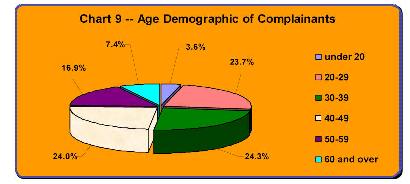
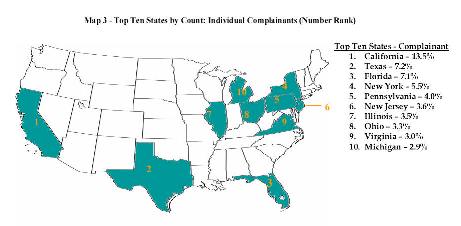
- nearly half were between the ages of 30 and 50 and one-third resided in one of the four most populated states: California, Florida, Texas, and New York.
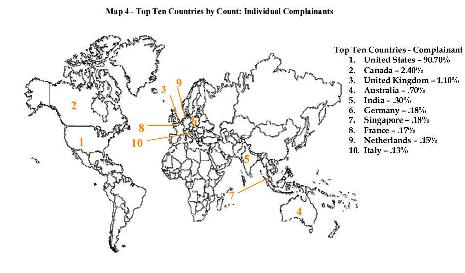
- While most were from the United States (92.4%), IC3 received a number of complaints from Canada, United Kingdom, Australia, India, and France.
- Males lost more money than females (ratio of $1.69 dollars lost per male to every $1.00 dollar lost per female). This may be a function of both online purchasing differences by gender and the type of fraudulent schemes by which the individuals were victimized.
- E-mail (74.0%) and webpages (28.9%) were the two primary mechanisms by which the fraudulent contact took place.
For the full report, go to the IC3 webpage on statistics.
2008 Patterns
In 2008, that ranking has changed considerably - Lottery scams are number, followed by Auction scams, non delivery and check fraud.
-
LOTTERY SCAMS
-
- INTERNET AUCTION FRAUDS
-
-
CONFIDENCE - NIGERIAN ADVANCE FEE FRAUDs (AFF)
-
-
PHISHING AND PHARMING FOR IDENTITY THEFT -
- "PASSIVE RESIDUAL INCOME" SCAMS
-
- CHECK (COUNTERFEIT) FRAUDS
- WORK-AT-HOME SCAMS
- MATRIX / MULTI-LEVEL MARKETING
AND PYRAMID SCHEMES
- FINANCIAL INSTITUTIONS SCAMS
How much money do victims typically lose?
Where are the scammers located?
The greatest concentration (per capita) of internet scammers in the United States are concentrated in the District of Columbia (Washington, D.C.) and Nevada. By sheer numbers, California, NY and Florida take the top three positions, based on their population sizes.
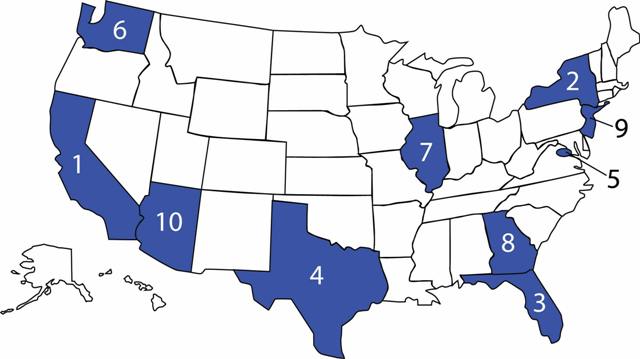
Map 1
- Top Ten States (Perpetrators)- California 15.8%
- New York 9.5%
- Florida 9.4%
- Texas 6.4%
- D.C. 5.2%
- Washington 3.9%
- Illinois 3.3%
- Georgia 3.1%
- New Jersey 2.8%
- Arizona 2.6%
Providing insight into the demographics of fraud perpetrators, in those cases with a reported location, over 75% of the perpetrators were male and over half resided in one of the following states: California, Florida, New York, Texas, District of Columbia, and Washington.
Globally, in 2008, most scammers operated from the United States. The U.S. still held a huge lead in active internet users then, a gap that has since closed considerably. In 2008, China and the U.S. each have approximately 200 million internet users, and most of the world has grow commensurately. As the user populations have grown abroad, so have their scammer populations. Several countries stand out in 2008 as have disproportionately huge populations of scammers: Nigeria, Romania, the Netherlands and China. Lottery and fake money transfer (AFF)frauds seem to be the specialty of the Nigerians. The United States still leads in Identity Theft and Phishing/Spoofing frauds.
These locations are among the most populous in the country. Controlling for population, the District of Columbia, Nevada, Washington, Montana, Florida, and Delaware have the highest per capita rate of perpetrators in the United States.
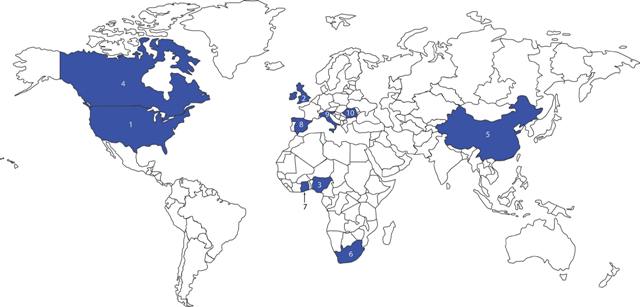
Map 2
- Top Ten Countries By Count (Perpetrators)- United States 66.1%
- United Kingdom 10.5%
- Nigeria 7.5%
- Canada 3.1%
- China 1.6%
- South Africa 0.7%
- Ghana 0.6%
- Spain 0.6%
- Italy 0.5%
- Romania 0.5%
Perpetrators also have been identified as residing in the United Kingdom, Nigeria, Canada, Romania, and Italy. Inter-state and international boundaries are irrelevant to Internet criminals. Jurisdictional issues can enhance their criminal efforts by impeding investigations with multiple victims, multiple states/counties, and varying dollar losses.
Who is being victimized?

The FTC's Annual List of Top Consumer Complaints
listed by state